|
Trim Optimization
|
HOME  |

|
Onboard Software for Trim Optimization of Ships for Reducing Fuel
Consumption for Ships Sizes 4,500-120,000 DWT.
Trim Optimization Sofware / Trim Optimizasyon Yazılımı
Dr. Ali Can TAKİNACI -
takinaci@itu.edu.tr -
takinaci@gmail.com (alternate
email)
TRIM
OPTIMIZATION SHOULD BE DONE BECAUSE THERE IS NOTHING TO INSTALL THE SHIP. IT
IS DONE BY CHANGING THE TRIMMING ONLY ACCORDING TO LOADING. IT IS SO SIMPLE
:-) :-)
OPTIMIZING TRIM
CAN DELIVER SIGNIFICANT FUEL SAVING. FOR ANY GIVEN LOADING (DRAFTS)
THERE IS A TRIM CONDITION GIVING MINIMUM ENGINE POWERS. IN SOME SHIPS, IT IS
POSSIBLE TO ASSES OPTIMUM TRIM CONDITION FOR FUEL EFFICIENCY CONTINUOUSLY
THROUGHOUT THE VOYAGE.
FOLLOWING THE
PERSONAL EXPERIENCES GAINED FROM COMPUTATIONS OF THE WHOLE FLEET OF BESIKTAS
GROUP THE SHIPS 10K-80K ARE IN THE MOST BENEFICIAL SIDE OF THE TRIM
OPTIMIZATION (5-10% IN ENGINE POWER). THE CAPE SIZE‘s ARE POOR, SMALLER
TONNAGES WOULD YIELD TO 4-7% REDUCTION IN ENGINE POWER.
DETAILED
EXPLANATIONS AND DEMO PROGRAM ARE CAN BE FOUND HERE.
Trim Optimization in IMO
Documents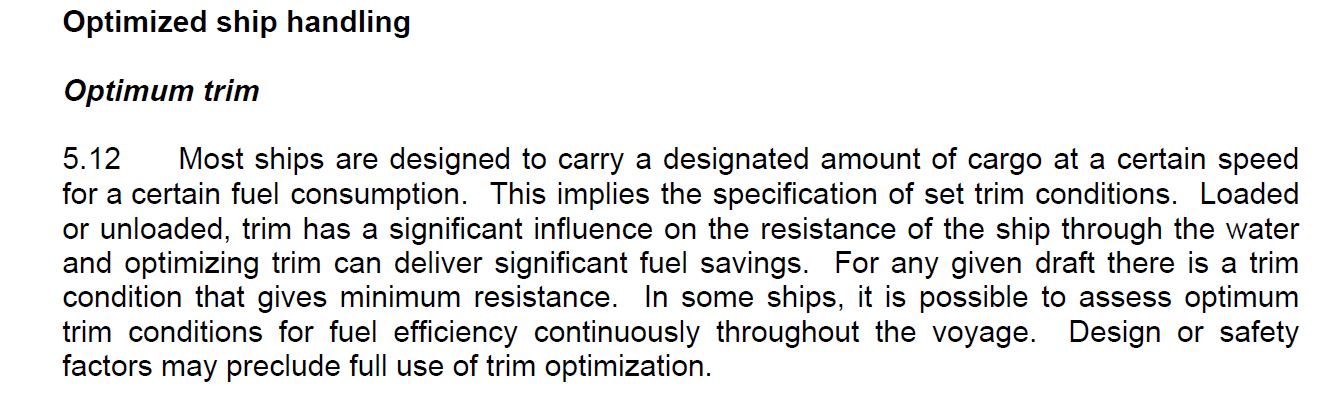
Download Trim Optimization Presentation - Turkish
Download Trim Optimization Presentation - English
Download demo version of the program (standard 57K BC) - Excel
Macro and Visual Basic Version
Deniz Ticaret Odası Gazetesi 'nde 25 Mayıs 2022 tarihinde
yayınlanan makale
Koster
Armatörleri ve İşletmecileri Derneği KOSDER organizasyonu ile
gemilerde trim ve pervane piçi optimizasyonu ile yakıt tasarrufunun
nasıl sağlanacağına dair dikkat çekici bir YOUTUBE sunumu.
Kosder Derneği 'nda yayınlanan sunumun slaytları.

TRIM OPTIMIZATION
|
Trim
Optimization model presented through this
web page is a new energy/fuel saving system for ships
which are currently under service. It
offers the best loading conditions for different service speeds.
The model is supported by an on-board computer program
which guides to
the captain to choose the best possible trim condition.
Trim Optimization
model mainly
needs the following files.
1. 2D Form Plans or 3D
Geometry of Hull Form.
2.
Towing Tank
Test Report.
If the report do not exist the analysis can not be performed or
tank tests must be carried on.
3. Propeller Geometry.
4.
Knowledge about main propulsion unit, reduction gear ratio,
shaft generator, etc.
5.
Recent Voyage Reports covering all loading drafts.
|
|
TRIM OPTIMIZATION SOFTWARE BUNDLE
|
Trim
Optimization model is composed of a software
bundle. The computer programs are totally in-house programs
written in either Visual Basic or Fortran Programming Languages.
The final on-board software is Microsoft Excel Based where
visual basic macro run background.
|
Resistance and Quasi Propulsive
Analyses
|
Resistance analysis is based on the
model of The Methods of Holtrop and Mennen. But it is should be
arranged the wave-resistance and the roughness allowance
formulations in the model to satisfy the real tested values in
the towing tank test report. Therefore a powerful prediction has
been made for the trim lines except that the trim lines for the
towing tank tests have neen carried on.
The same
procedure has been applied for quasi-propulsive coefficients.
The Holtrop and Mennen Model offers a powerful prediction of
such coefficients. A group of scale ratios have been created
through known tank test reports and these ratios have been
interpolated for other trim lines which do not exist in the
towing tank report.
The software
used in this phase is a Fortran based which is no visual output.
The output of this phase will be the data of the next.
|
Propeller Hydrodynamic Performance
Evaluation
|
The evaluation of propeller
hydrodynamics or, in other words, propeller open water data
is indispensible part of this software bundle. The
propulsion analyses yielding to the prediction of machinery
power can not be performed without propeller open water
performance data.
Propeller
open water characteristics can be computed via
well-established, in-house software's. The software's in
that area are three main types. Lifting-line analysis,
lifting surface analysis and panel methods. Beside of these
commercial CFD software's exist. All methods used in that
area needs the use of some special factors. To be a
propeller designer or analyst or a knowledge of a commercial
software which are popular nowadays are definitely not
adequate. It needs fully understanding of nature of
propeller and wake flows. This is only done by working in
cavitation tunnel or a towing tank or a propeller company.
Otherwise the predictions may be wrong !!!
The 3D
representation of the propeller whose diameter is 6.3 meters
working in 90K DWT BC.
The panel method representation of
the same propeller given above.
The Kt-Thrust coefficient of
the same propeller. As it was seen in the picture different
algorithms give different results. Choosing the correct
value is an expertise type of job. In that example the
output from the lifting surface algorithm (Curve Kt-LSM) has
been preferred.
All software's used in this phase
are Fortran programming language based. The output file of
this part will be that data of the next.
|
Propulsion Analyses
|
Together with the Resistance and
propeller hydrodynamic data (open water values), propulsion
analysis can be performed to find correct engine power and
propeller revolution.
The
software used in this phase is a Fortran based which is no
visual output. The output of this phase will be the data of
the next.
|
Reporting
|
The reporting software is an
Microsoft Excel (2013 Version) file working with Visual
Basic Macro background. This file groups and creates
everything. Produces tables, contour plots etc. It also
plays the role of an on-board software obtaining best trim
condition for existing load case.
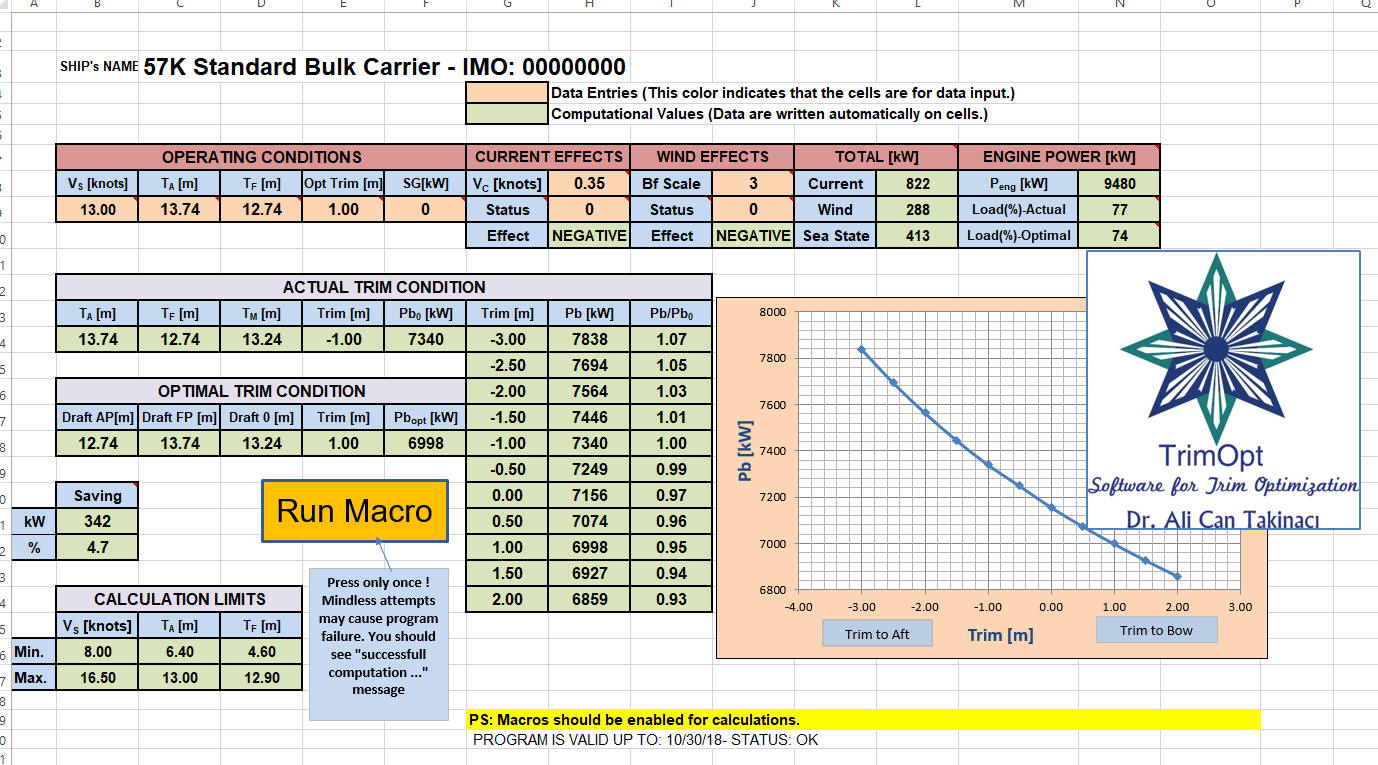
The figure
shows one of the outputs of this software. Contour plots can
tell important knowledge with a simple plots that can be
interpreted via numerous numbers of tables etc.. The plot
shown above was created 14 knots of service speed. Iso
curves are the main engine loads computed from the previous
phase. Therefore the crew can find optimum loading line by
inspecting the plot.
Another important feature of this
software lays on its on-board characteristics. The figure
shown below is the main page of the program.
The crew only enters speed, aft and
fore drafts initially. The speed is written in B9 cell, aft
and fore drafts are written in C9 and D9 cells, power of
shaft generator is written in F9 cell; current, wind effects
are written in H9 and J9 respectively with their conditions
(0=negative, 1=positive, 2=neutral for H10 and J10), power
of main propulsion unit is written in cell N9 and and let
the program run by clicking "Run Macro" button. The
Trim-Engine power curve is generated. Then, by inspecting
the nature of plot, the crew should make a decision about
the optimum trim. The optimum trim values shown in the
graphs may not be applicable practically. But, say, 1 meter
trim to bow is written in E9 cell and let the program run
for 1 meter trim to bow condition the outputs appear in F14
and F18 cells. F14 cell tells original trim (in this example
zero trim) case. F18 cell tells the current 1 meter trim to
bow case. The differences are also shown in cells B21 and
B22 and their loads are appeared in cells N9 and N10.
As an example of a real case 13.74/12.74
meters of aft and fore drafts, the required engine power is
about 7340 kWs. If the captain prefers bow trim condition
(12.74,13.74 m aft and fore drafts), the engine power
would have been 6998 kWs, therefore
4.7% power gain could be obtained. The software can produce this plots for
different ships' speeds.
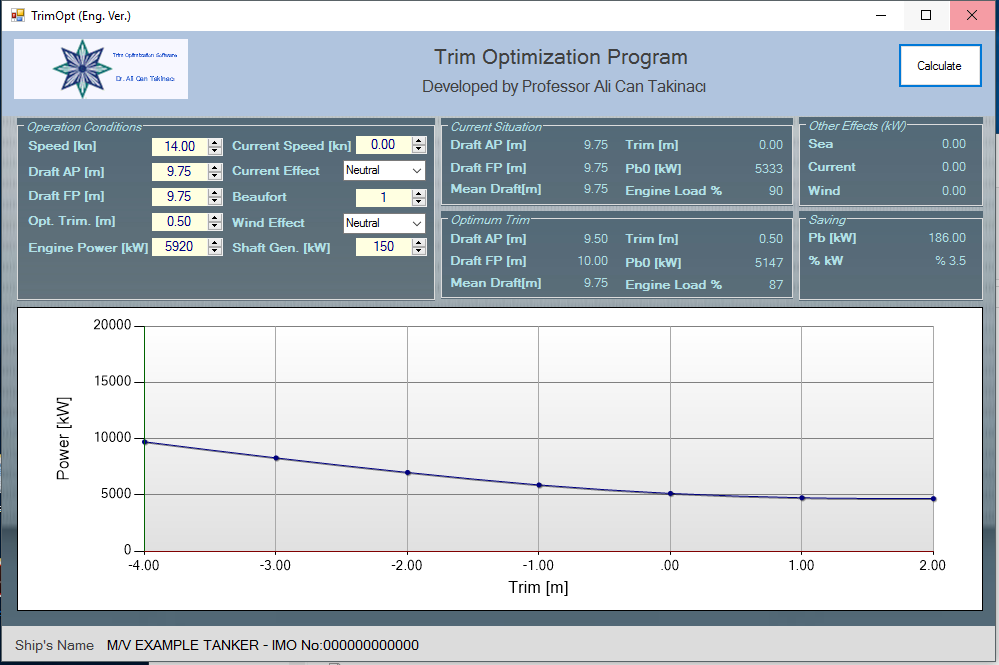
Excel Version of the Program
In addition to excel version of the
program, a new version developed under Visual Basic 2010 is
introduced.
Standalone file version of the
program
|

|
|
