|
Tuncay
Taymaz, Onur Tan and Seda Yolsal |
|
|
Seismological Parameters Reported
DATA Processing and Inversion We use USGS location. |
HARVARD EVENT-FILE NAME M122604A |
|
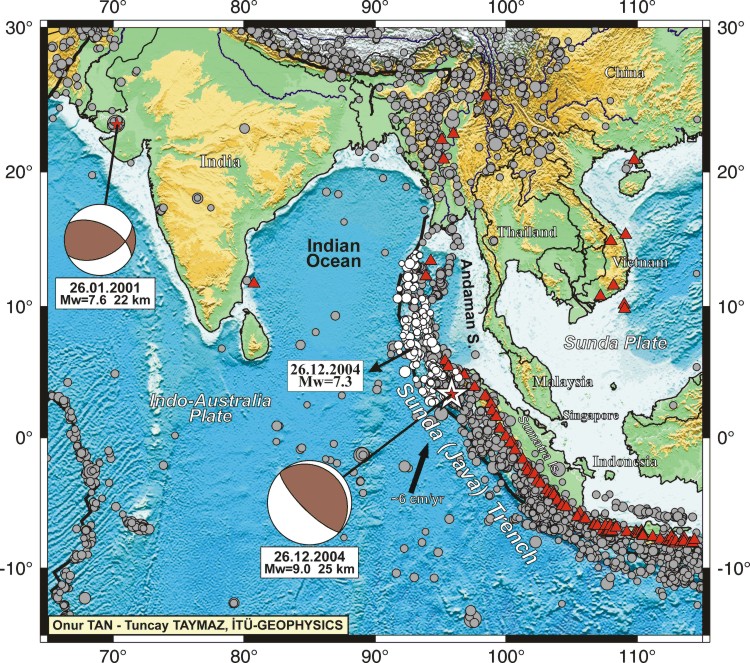
Regional Tectonic Setting The devastating megathrust earthquake of December 26, 2004, occurred on the interface of the India and Burma plates and was caused by the release of stresses that develop as the India plate subducts beneath the overriding Burma plate. The India plate begins its descent into the mantle at the Sunda trench, which lies to the west of the earthquake's epicenter. The trench is the surface expression of the plate interface between the Australia and India plates, situated to the southwest of the trench, and the Burma and Sunda plates, situated to the northeast. Further Details are under the following link:
Global Digital Elevation Model used are obtained through USGS-GTOPO-30 and resampled every 2 minutes. http://edcdaac.usgs.gov/gtopo30
MEASURED AND ESTIMATED SEAFLOOR TOPOGRAPHY obtained and reprocessed after Smith, W. H. F., and D. T. Sandwell, Global seafloor topography from satellite altimetry and ship depth soundings, Science, v. 277, p. 1957-1962, 1997. |
|
|
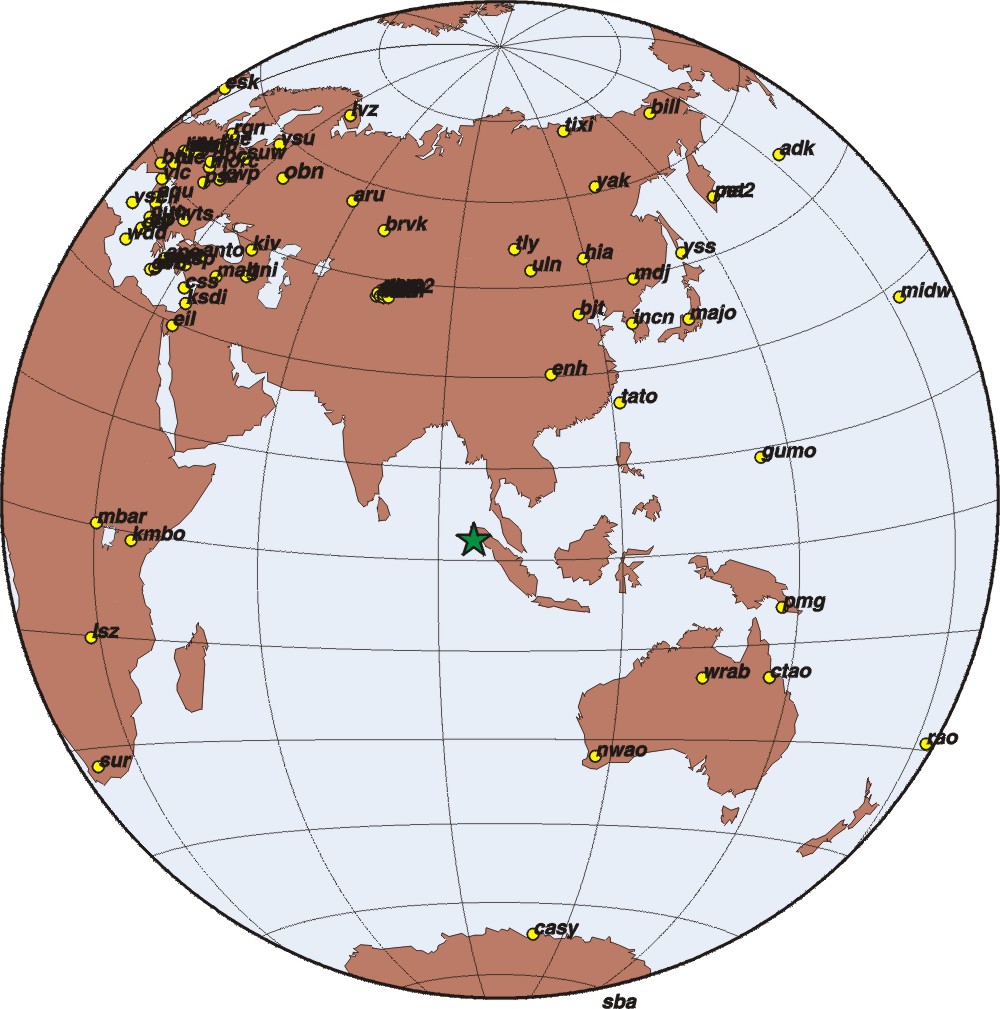
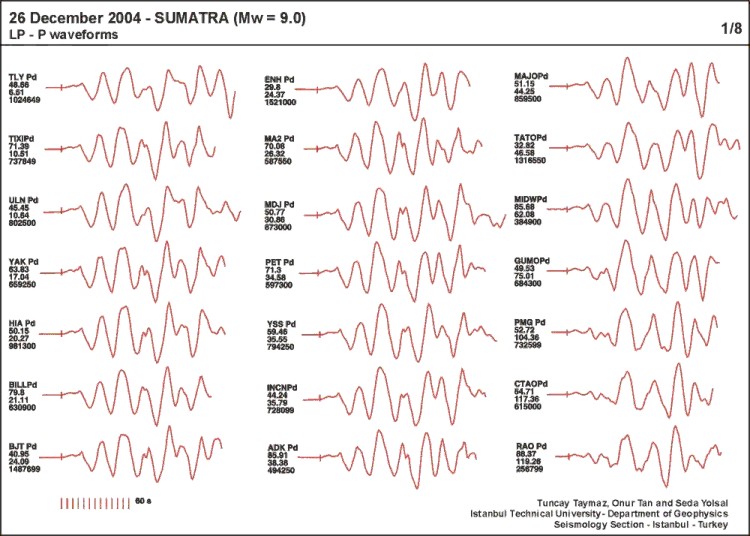
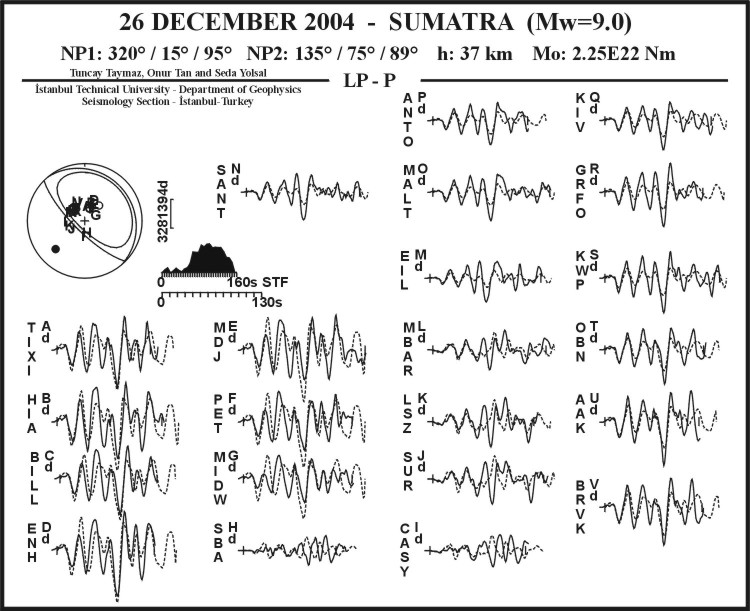
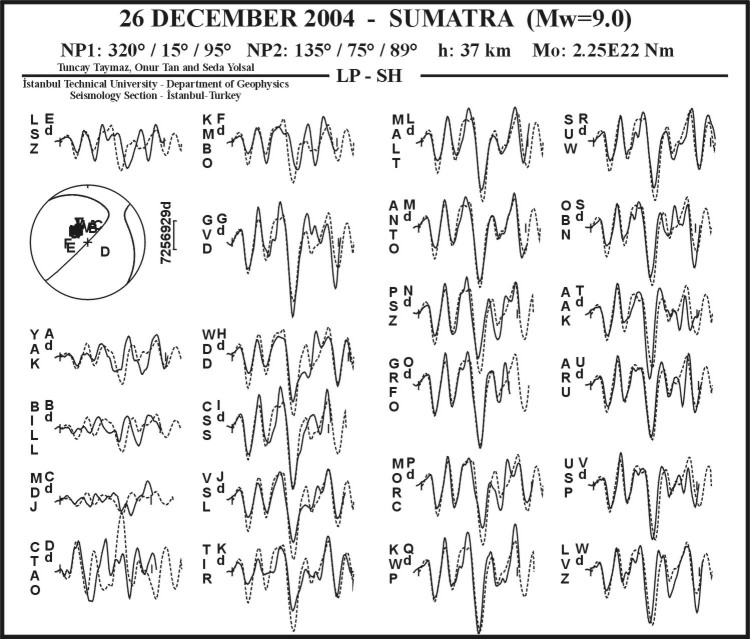
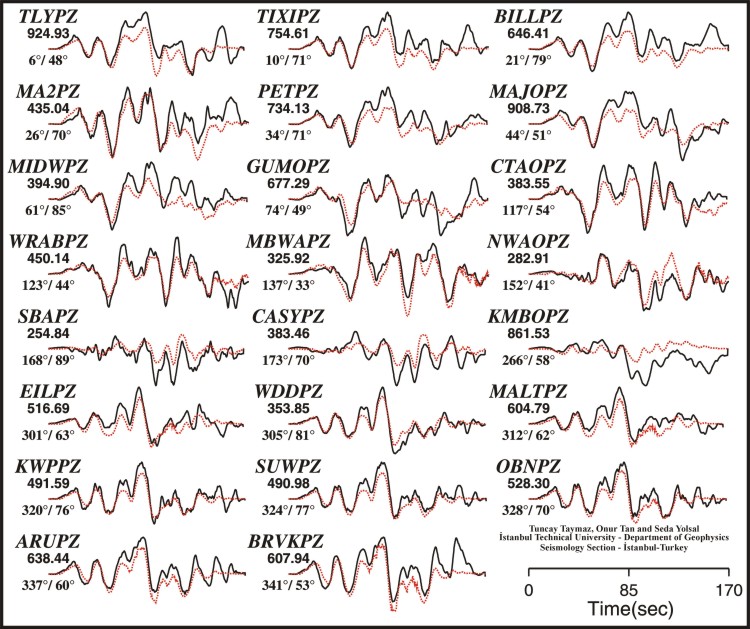
Teleseismic Long-Period Waveforms Azimuthal distributions of teleseismic Long-Period P- and SH- Waveforms of the December 26, 2004 Sumatra earthquake (Mw=9.0) recorded by GDSN stations in the distance range of 30–90° are shown. Station code, phase type, type of instrument (d:GDSN long period) epicentral distance (°), azimuth angle (°) and wave amplitude (in microns) are given at the left of the each waveform, respectively.
|
Long-Period P- Waveforms [ 1 ] [ 2 ] [ 3 ] [ 4 ] Long-Period SH- Waveforms [ 1 ] [ 2 ] [ 3 ] [ 4 ]
|
|
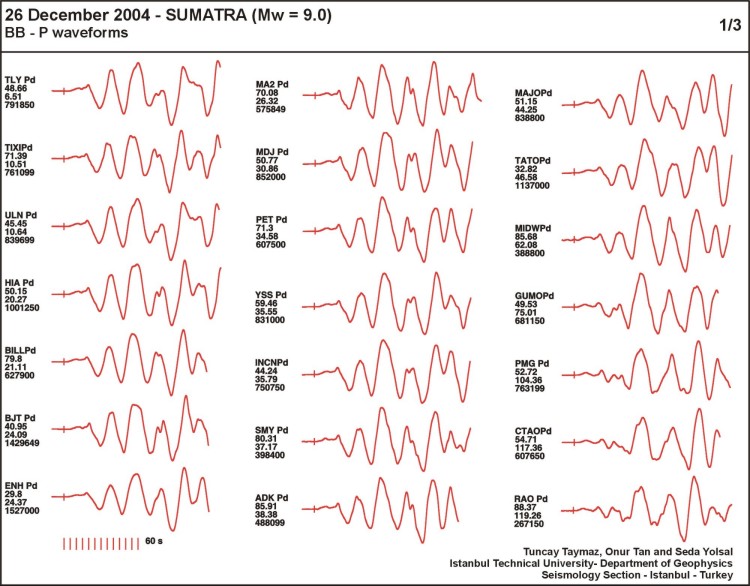
Teleseismic Broad-Band Waveforms Azimuthal
distributions of teleseismic Broad-Band |
Broad-Band
P- Waveforms [ 1 ]
[ 2 ] [
3 ]
|
|
Long-Period
P- and SH- Waveform Minimum misfit solution is obtained by using teleseismic long-period P and SH waveforms for the earthquake of 2004 December 26. Body-waveform inversion method of Nábélek (1984: Ph.D Thesis) which minimizes, in a weighted least-squares sense, the misfit between observed and synthetic seismograms, is used to determine the earthquake source parameters. Solid and dashed lines are observed and synthetic waveforms, respectively. Station positions are indicated by letter, and are arranged alphabetically clockwise, starting from north. Seismograms were weighted according to the azimuthal distribution of stations, such that stations clustered together were given smaller weights than those of isolated stations (McCaffrey and Abers, 1988). P and T axes are marked by solid and open circles. -- Nodal
Plane 1-- --
Nodal Plane 2 -- --
Principal Axes -- -- Focal Depth (h): 37 km -- -- Seismic
Moment (Mo) -- -- Source
Time Function (STF) -- -- Velocity Structure Used -- Two-layered velocity structure used with 2.5 km water column and 5 km of thickness of 1st layer overlained above half-space, and the relevant velocities are summarised below:
Z-top Vp
Vs Rho c- -- References -- Nabelek, J.L., (1984). Determination of earthquake source parameters from inversion of body waves, PhD Thesis, M.I.T., Massachusetts, U.S.A. McCaffrey, R. and Nabelek, J.L.,(1988). The geometry of back-arc trusting along the eastern Sunda Ark, Indonesia: constrains from earthquake and gravity data Journal of Geophysical Research, 89, 6171-6179. Taymaz, T. and Jackson, J.A. and McKenzie, D., (1991). Active Tectonics of the North and Central Aegean Sea, Geophysical Journal International, 106, 433-490, |
|
|
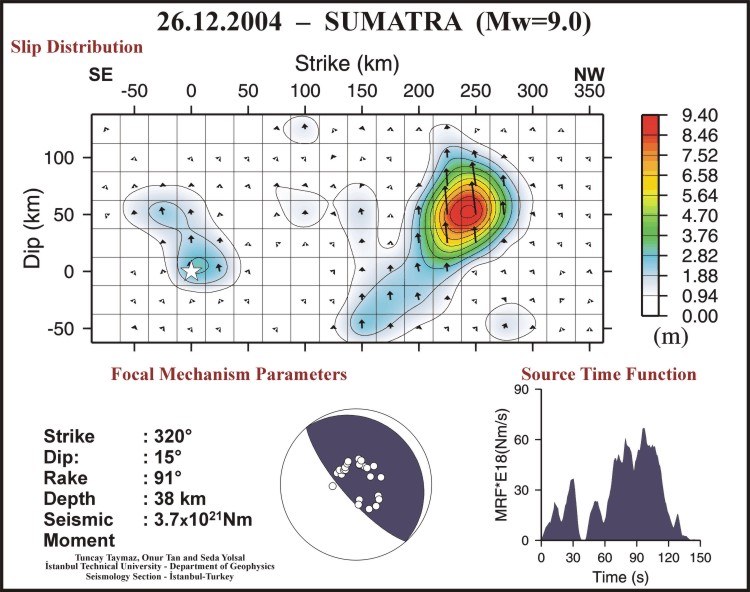
Source
Rupture Processes and Teleseismic Broad-Band P-Waveforms are used to constrain source rupture processes and slip distribution modelling developed by Yagi and Kikuchi (2000)
Data
sampling : 0.2
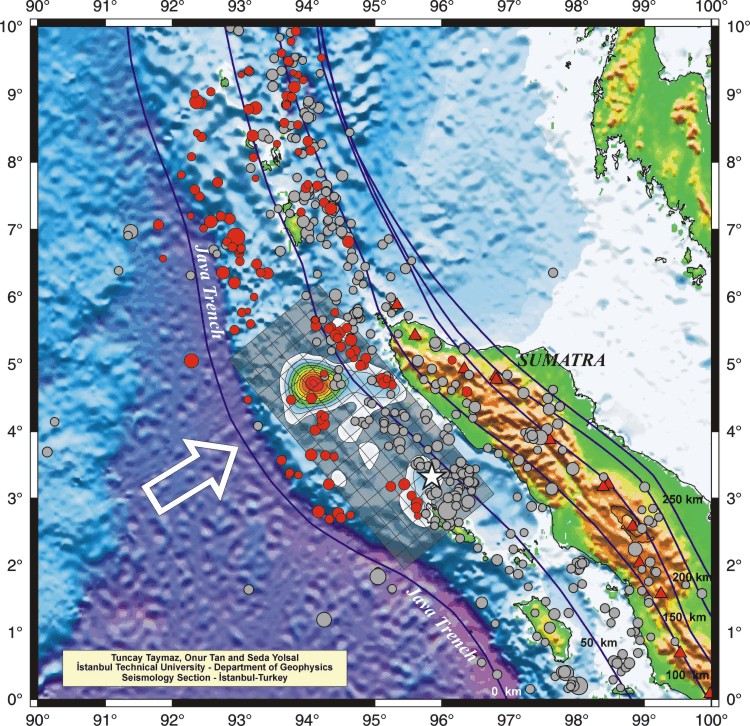
sec The map view of the co-seismic slip distribution of the Sumatra Earthquake. The rupture began at the focal (white star) and propagated to northwest. The high slip (~9.5 m max) occured on the bend of the Java Trench. Blue lines: Depth contours of the slab every 50 km (from RUM). Grey Circles: Seismicity of the region (USGS-NEIC 1973-2004, M>5.0) along Java Trench. Red Circles: Aftershocks of the Sumatra earthquake scaled with respect to their magnitude (USGS-NEIC, 26.12.2004 - 05.01.2005, M>4.0).
The co-seismic slip distribution of the Northern Sumatra Earthquake. The black arrows show the slip vectors of each sub-fault obtained.
The azimuthal station distribution are shown on the focal mechanism solution with white circles. The maximum Slip (displacement) is ~9.5 m.
Observed (black-solid) and synthetic (red-dotted) waveforms, station code and maximum amplitude (microns) above, station azimuth/distance are shown below waveforms.
-- References -- Yagi, Y. and Kikuchi, M., (2000). Source rupture process of the Kocaeli, Turkey, earthquake of August 17, 1999, obtained by joint inversion of near-field data and teleseismic data, Geophysical Research Letters., 27, 1969-1972. Gundmundsson, O. and M. Sambridge, (1998). A regionalized upper mantle (RUM) seismic model, Journal of Geophysical Research, vol 103, No. B4, 7121-7136, 1998. |
|
|
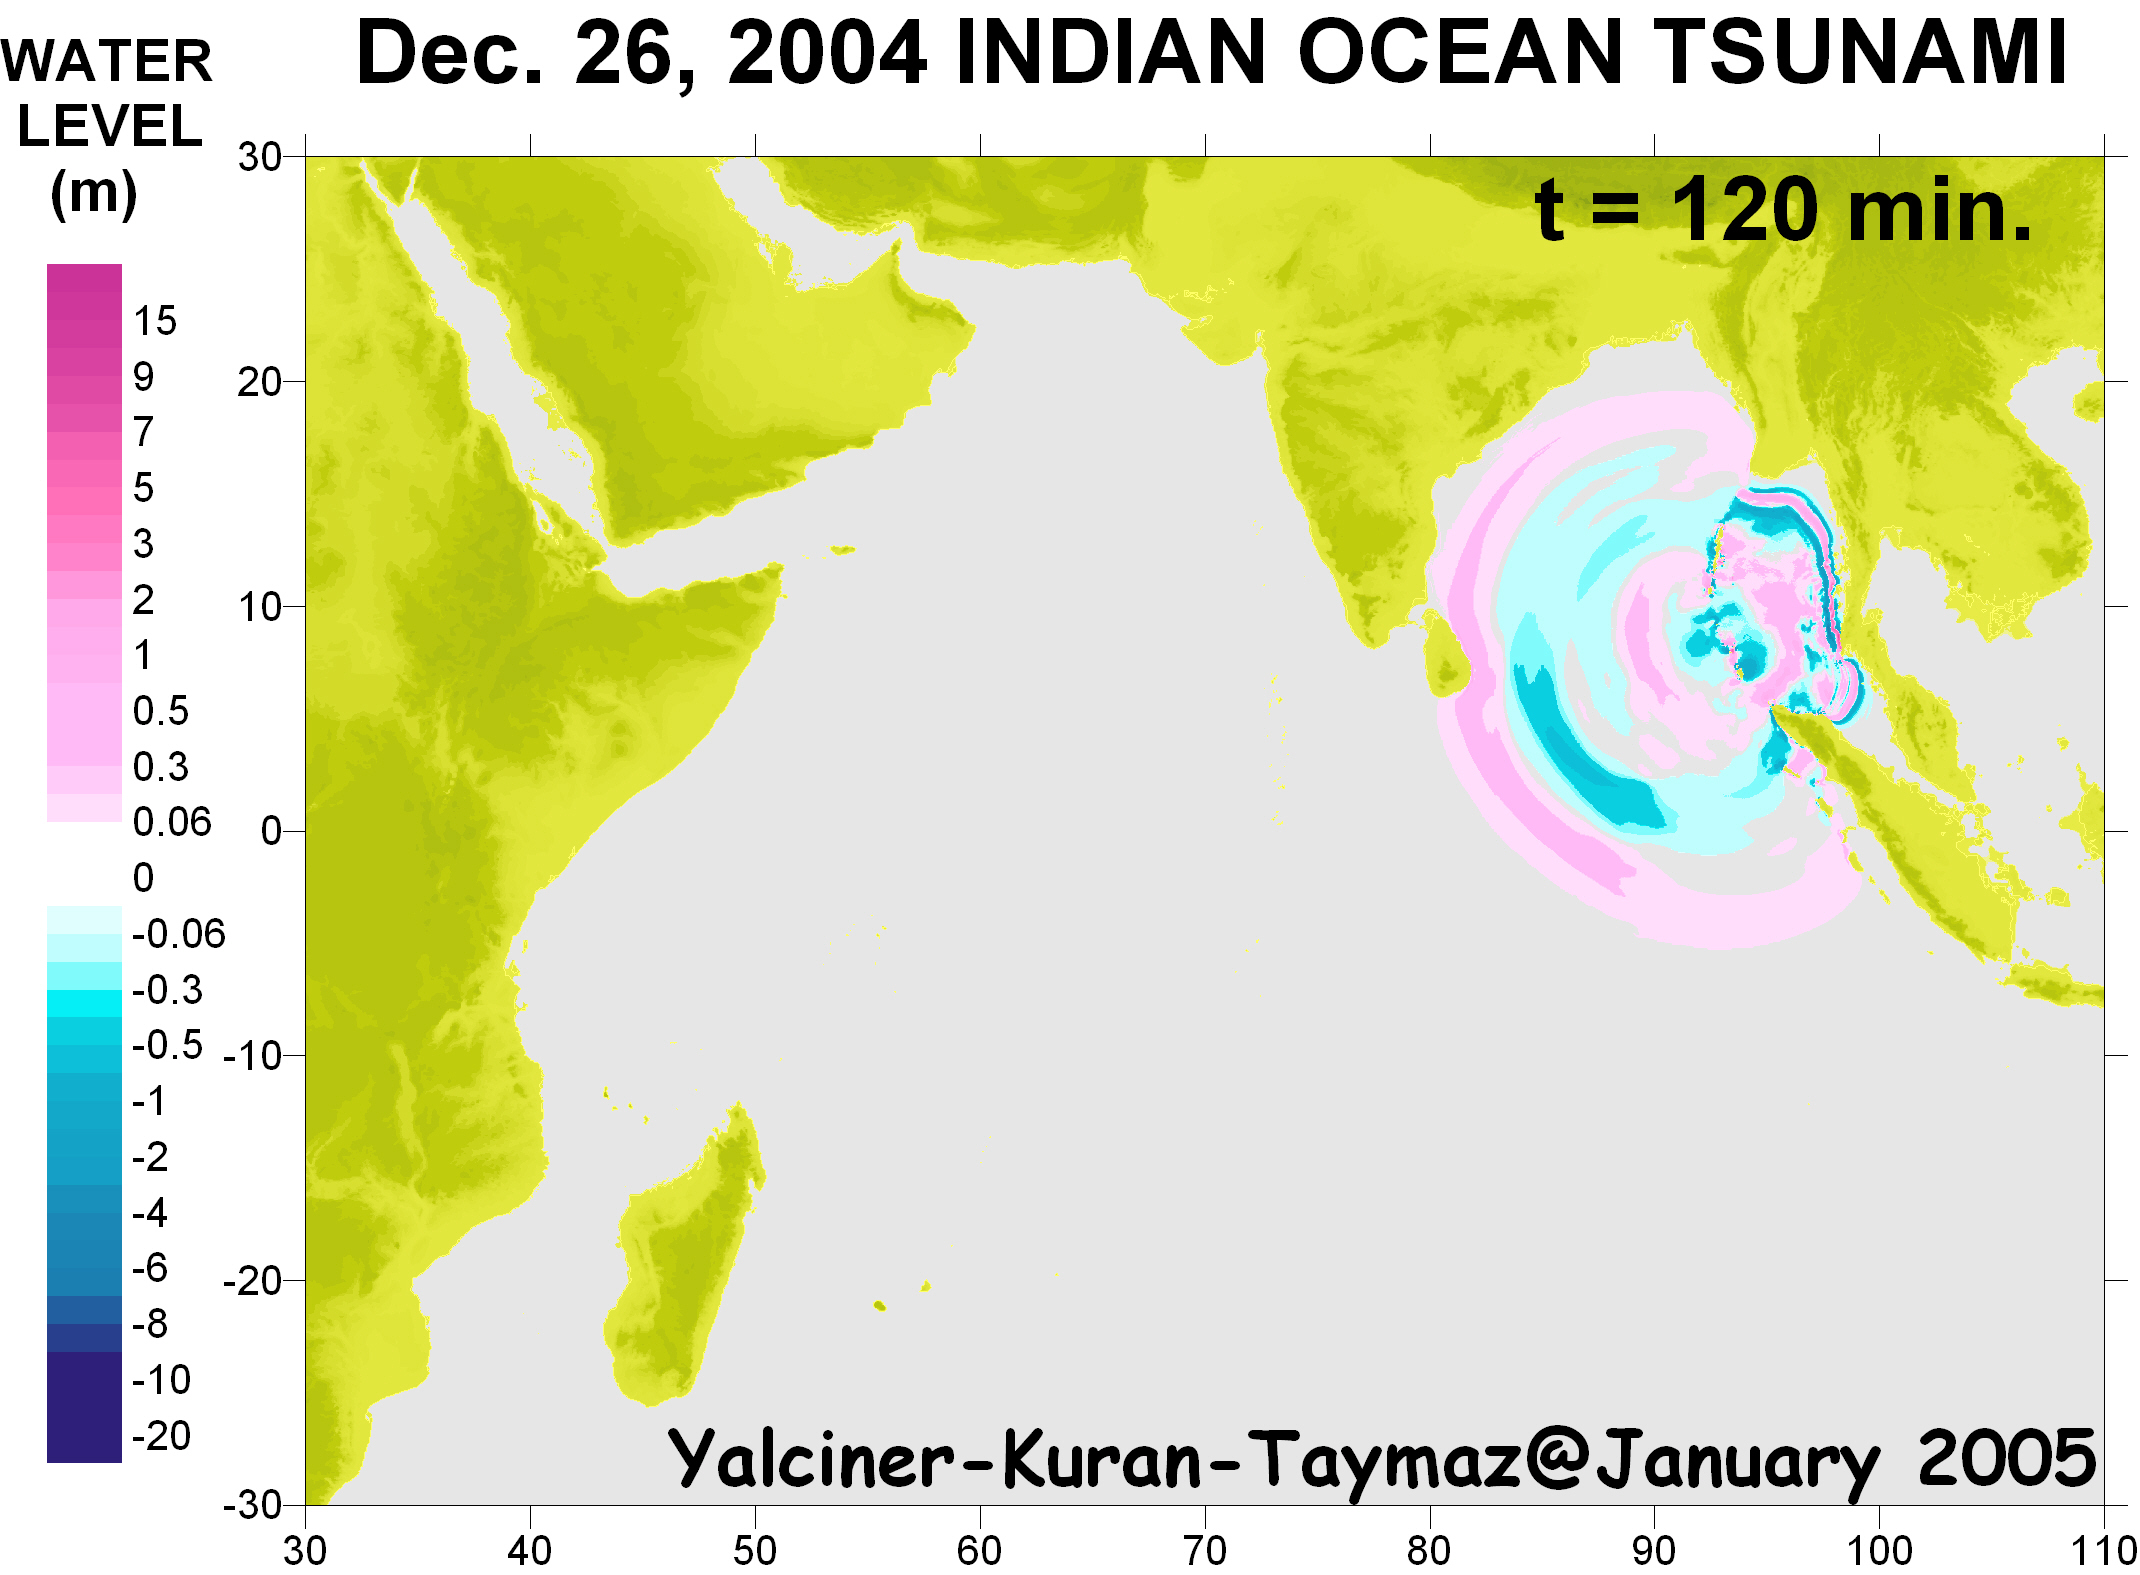
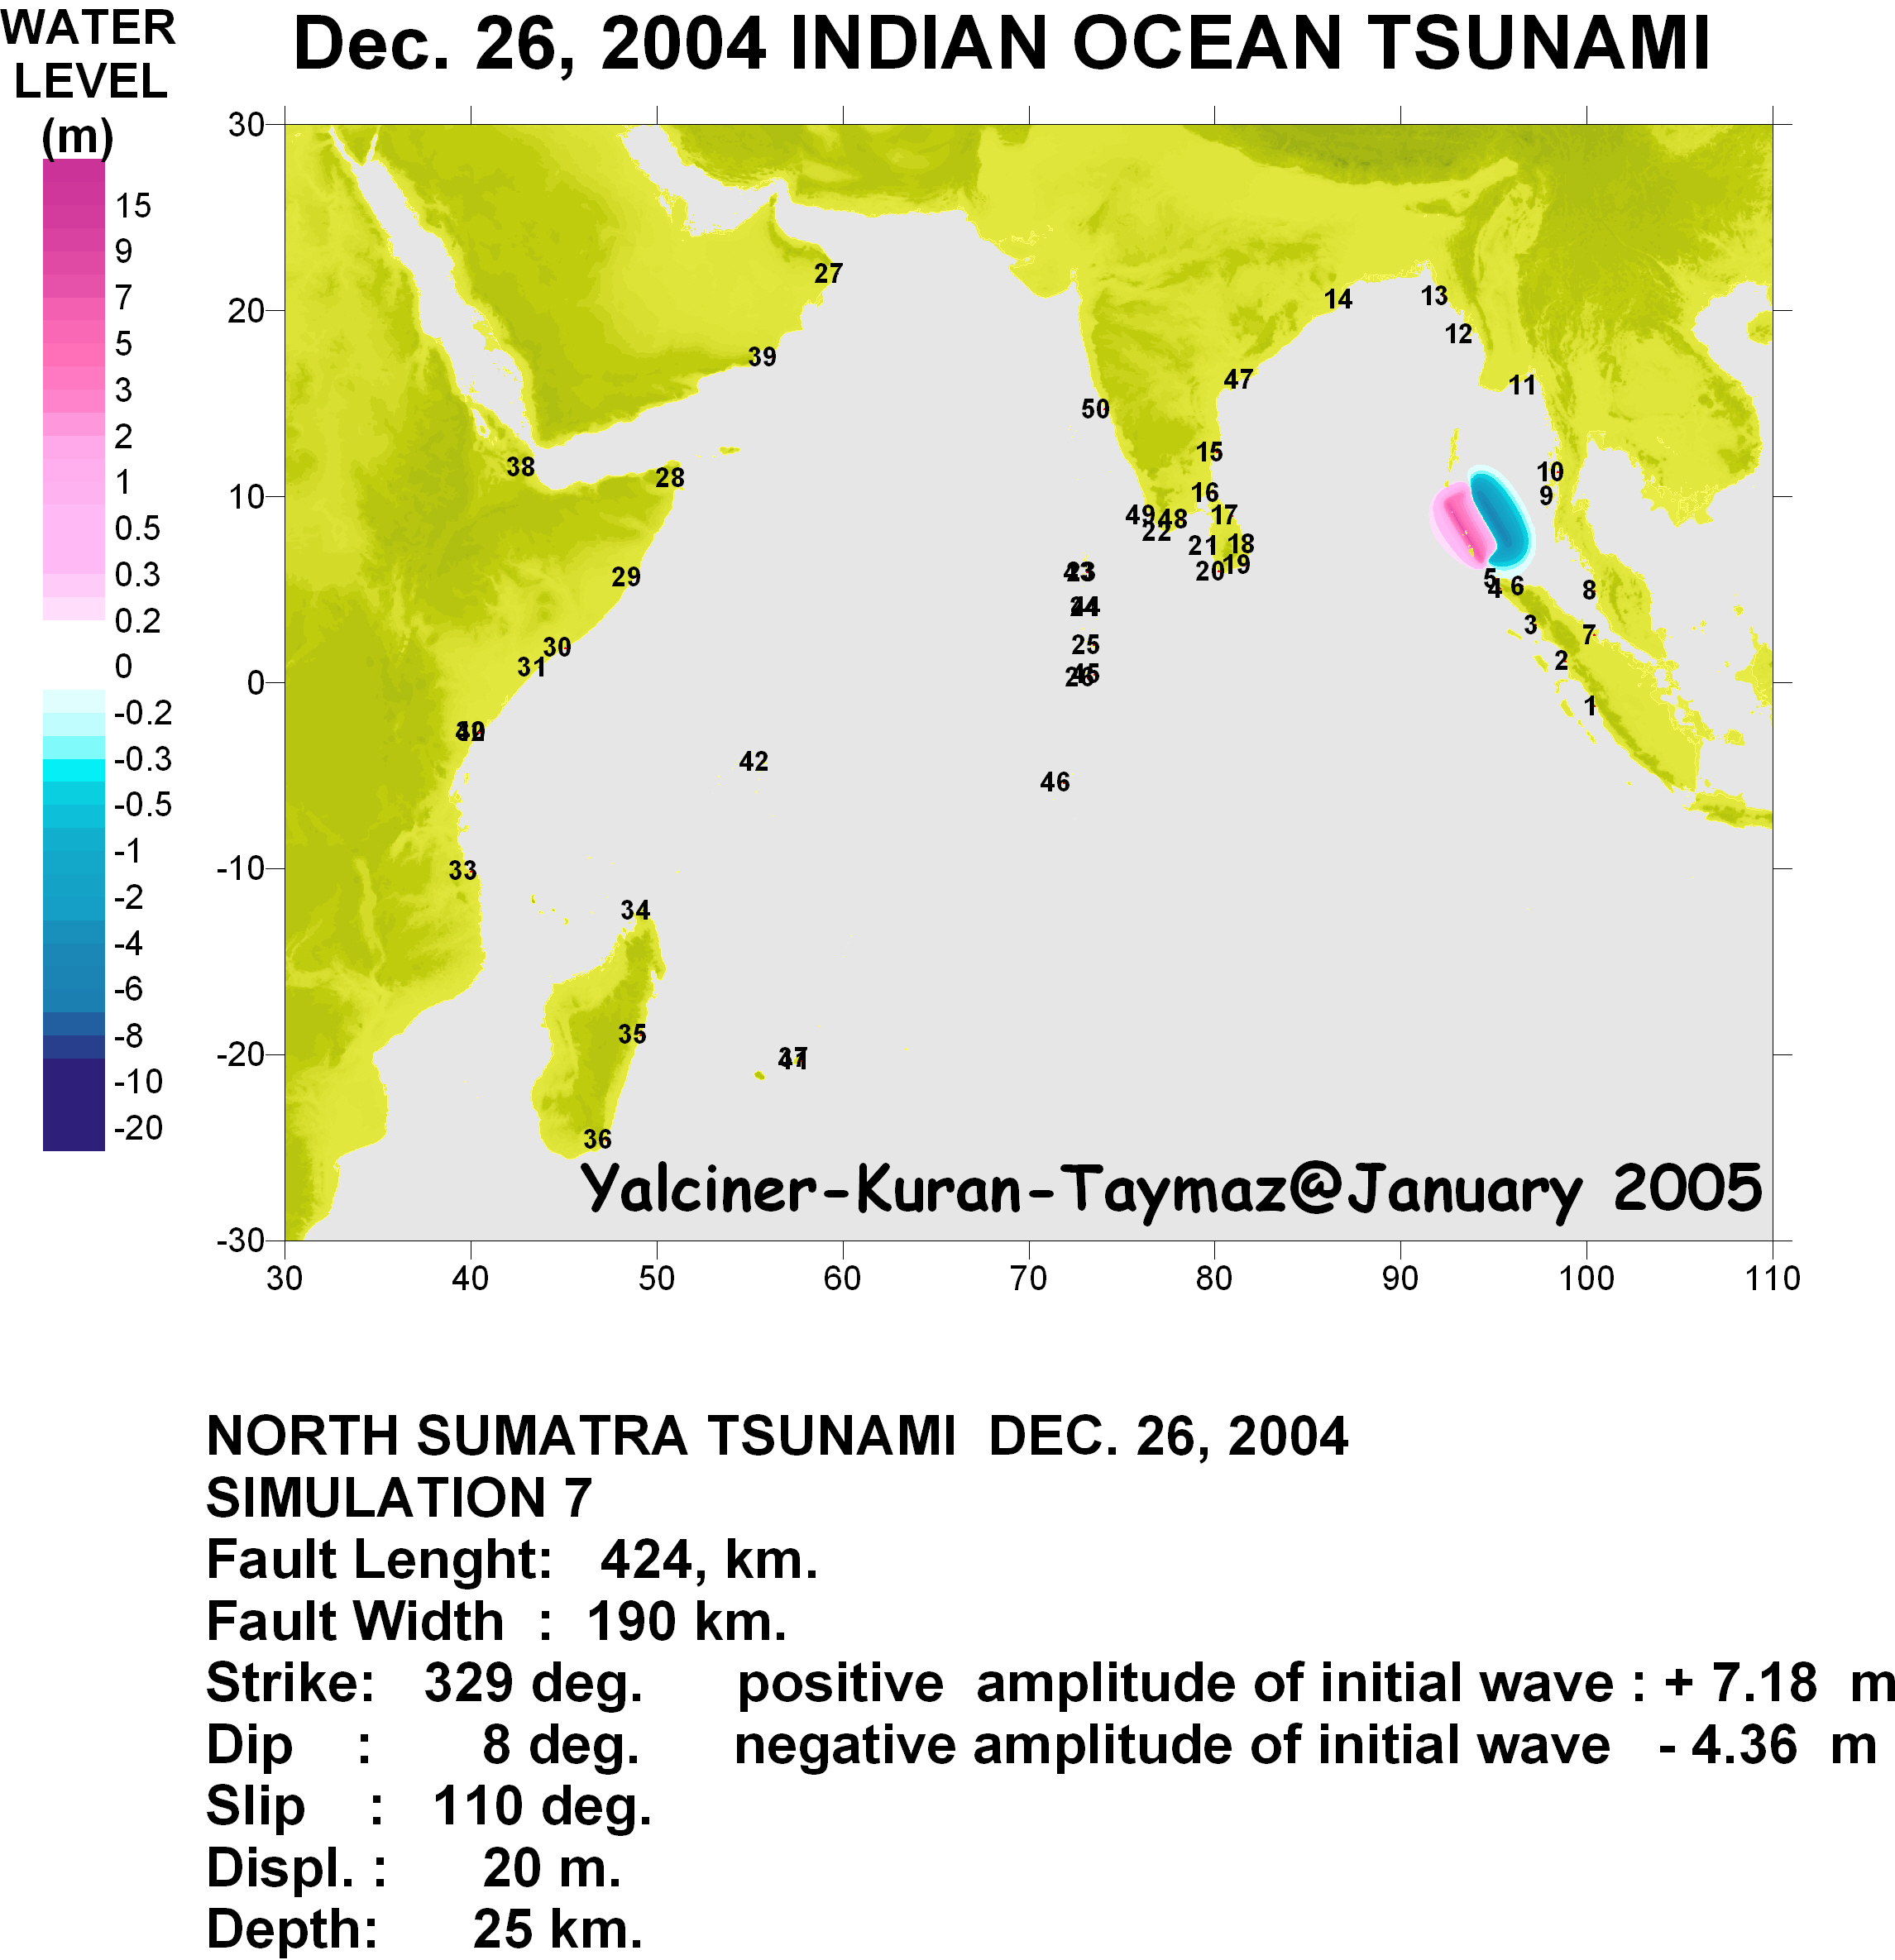
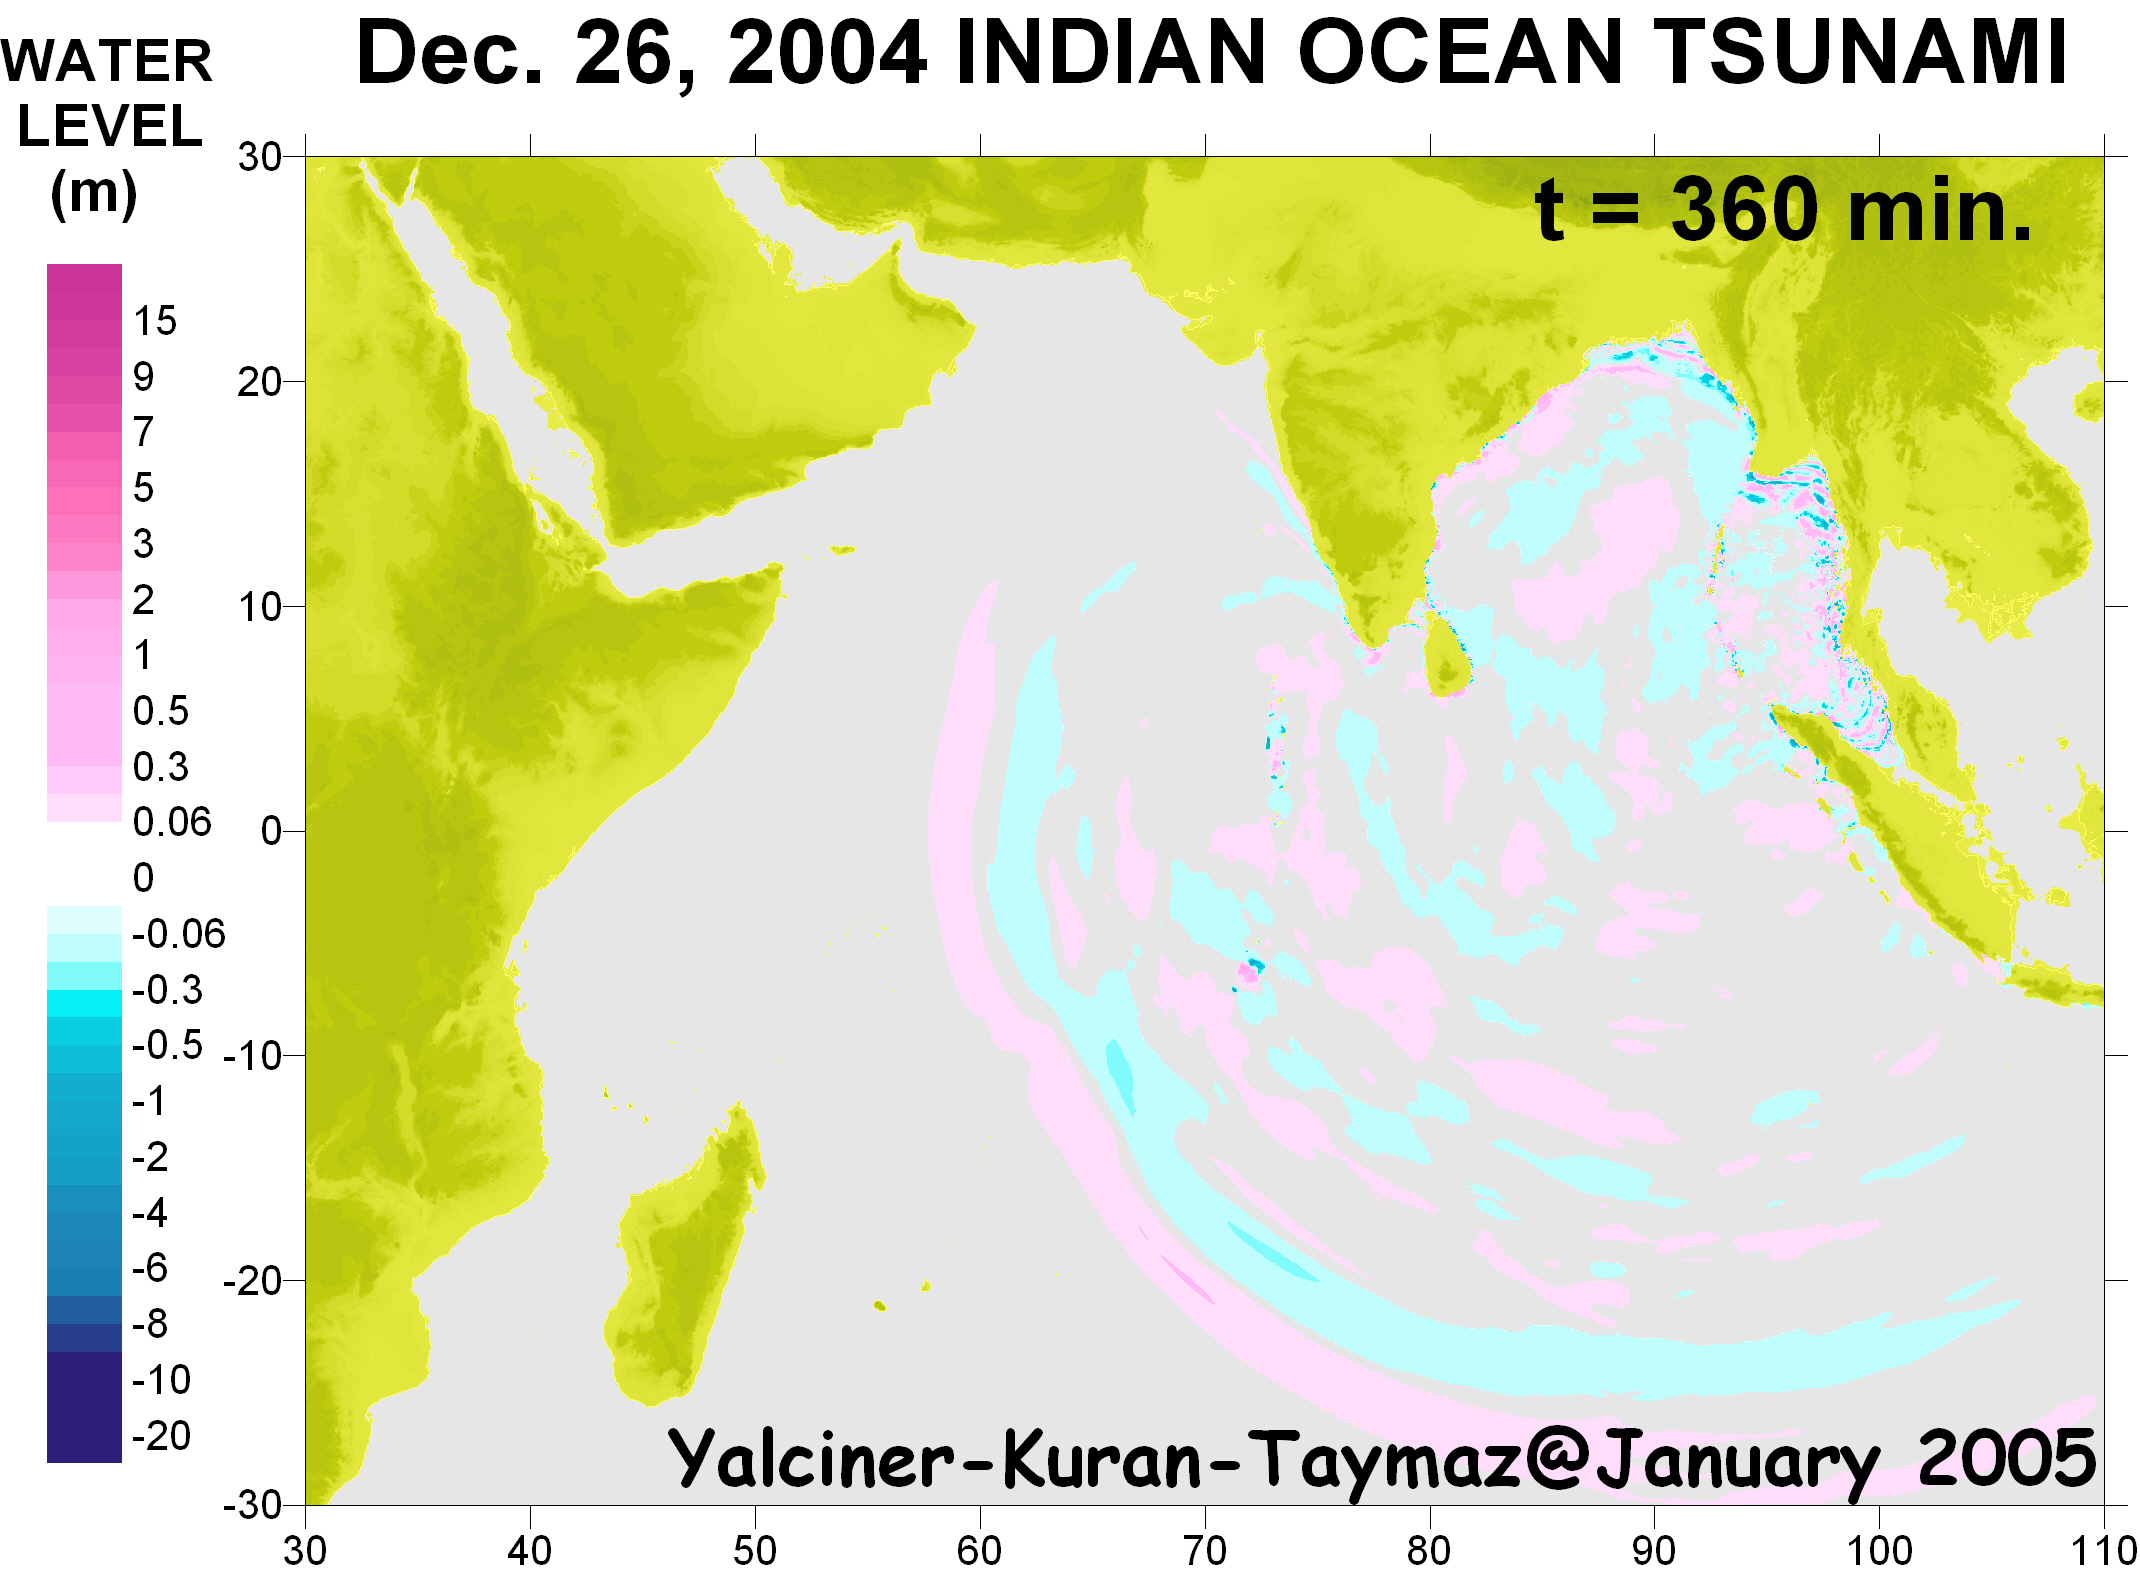
Tsunami Propagation Models Generated for further info http://yalciner.ce.metu.edu.tr/sumatra The generation, propagation and coastal amplification of tsunami waves are
modeled using TUNAMI N2 software. TUNAMI N2 is authored by Fumihiko
Imamura in Tohoku University Japan, and developed in Middle East Technical
University by Ahmet Cevdet Yalçıner, and in the University of Southern
California by Costas Synolakis. It is UNESCO TIME Project Product. The
model applications for this event by Ceren Özer, Hülya Karakuş, Gülizar
Özyurt and Ilgar Şafak at Middle East Technical University (METU), Ankara-Turkey and
Efim Pelinovsky and Andrey Zaitsev from Institute of Applied Physics, Russian Academy of
Sciences, During the estimate stage of the intial wave We have exchanged contributions from Ugur Kuran, Prof. Tuncay Taymaz and Prof. Emile Okal. We acknowledge Prof. Efim Pelinovsky for providing the batymetric data. The simulation had been done by TUNAMI-N2 which was authored by Prof. Fumihiko Imamura in Tohoku University Japan, and developed in Middle East Technical University-Ankara under support of TÜBİTAK and by collaboration with Prof. Costas Synolakis in Univerity of Southern California, USA and licenced by Imamura-Yalciner-Synolakis. We cordially share all results and wish to collaborate all further researches. You can also share these results with any interested colleagues. We have made the following simulations: SIMULATION 1: Our first estimate of the tsunami source on the date of earthquake and tsunami was based the fault data Fault Length and Wi dth are 666km and .90 km respectively. Strike Angle 340 Dip angle 13 Slip Angle 55 Displacement 20 m Focal Depth 7 km. The initial wave has the maxiumum positive amplitude : 7.18 m Shown in the figures (links) below: http://yalciner.ce.metu.edu.tr/sumatra/0001/faultwave.jpg The sea state and propagation of the wave at different time steps in Indian Ocean can be seen in the following figures: http://yalciner.ce.metu.edu.tr/sumatra/0001/a000.jpg The distribution of maximum apmlitude in the Ocean throughout simulation
duration http://yalciner.ce.metu.edu.tr/sumatra/0001/azmax-600dpi.jpg The runup distributions along the Coast of Indonesia The runup distributions along the Coast of North of Thailand The runup distributions along the Coast of South of Thailand The runup distributions along the North Coast of Indian Ocean The coastlines where runup ditributions are computed SIMULATION 2: BY USING SPHERICAL COORDINATE SYSTEM WITH CORIOLIS FORCE EFFECT by Andrey Zaitsev and Efim Pelinovsky Institute of Applied Physics, The same fault data given above has also been used in simulation Initial wave http://yalciner.ce.metu.edu.tr/sumatra/spherical/t0.jpg After 2 hours Runup Distribution http://yalciner.ce.metu.edu.tr/sumatra/spherical/ruup_area_lable.jpg SIMULATION 7 Animation http://yalciner.ce.metu.edu.tr/sumatra/0007/sim-7-b-60dpi-600min.gif Fault Length 419 km In this simulation we have used shorter length of the fault
by using the fault plane solutions (by Prof. Tuncay Taymaz) and historical earthquakes
(Geophysicist ugur Kuran) of the fault zones at West of Sumatra. We have put the animation of several files in the following link about the
results of recent Simulation 7. The jpg files showing the sea state at different time steps are also shown in the following links. (The file name represents the time in minutes) http://yalciner.ce.metu.edu.tr/sumatra/0007/0000.jpg The distribution of maximum positive amplitudes in Indian
Ocean throughout 900 minutes simulation is in the link below The time histories of water surface fluctuations at some gauge locations near West of Sumatra http://yalciner.ce.metu.edu.tr/sumatra/0007/sumatrawest.jpg The time histories of water surface fluctuations at some gauge locations near East of Sumatra http://yalciner.ce.metu.edu.tr/sumatra/0007/sumatraeast.jpg The time histories of water surface fluctuations at some gauge locations near Thailand http://yalciner.ce.metu.edu.tr/sumatra/0007/thailand.jpg The time histories of water surface fluctuations at some gauge locations near Burna http://yalciner.ce.metu.edu.tr/sumatra/0007/burma.jpg The time histories of water surface fluctuations at some gauge locations mear Bangladesh http://yalciner.ce.metu.edu.tr/sumatra/0007/bangladesh.jpg The time histories of water surface fluctuations at some gauge locations near the border of Bangladesh and India http://yalciner.ce.metu.edu.tr/sumatra/0007/bangladeshindia.jpg The time histories of water surface fluctuations at some gauge locations near India http://yalciner.ce.metu.edu.tr/sumatra/0007/india.jpg The time histories of water surface fluctuations at some gauge locations near India East Coast http://yalciner.ce.metu.edu.tr/sumatra/0007/indiaeast.jpg The time histories of water surface fluctuations at some gauge locations near India South Coast http://yalciner.ce.metu.edu.tr/sumatra/0007/indiasouth.jpg The time histories of water surface fluctuations at some gauge locations near Sri Lanka http://yalciner.ce.metu.edu.tr/sumatra/0007/srilanka.jpg The time histories of water surface fluctuations at some gauge locations near Maldives http://yalciner.ce.metu.edu.tr/sumatra/0007/maldives.jpg The time histories of water surface fluctuations at some gauge locations near Maldives-2 http://yalciner.ce.metu.edu.tr/sumatra/0007/maldives2.jpg The time histories of water surface fluctuations at some gauge locations near North West Ocean http://yalciner.ce.metu.edu.tr/sumatra/0007/westocean.jpg The time histories of water surface fluctuations at some gauge locations near Umman http://yalciner.ce.metu.edu.tr/sumatra/0007/umman.jpg The time histories of water surface fluctuations at some gauge locations at Djibouti http://yalciner.ce.metu.edu.tr/sumatra/0007/aden.jpg Figure of Tidal Wave measurements for Djibouti http://yalciner.ce.metu.edu.tr/sumatra/0007/mareg-11-aden.jpg We thank Kassim Mohamed and Jalludin Mohamed of Observatoire Géophysique d'Arta /CERD BP1888 Djibouti- R. of Djibouti (kassimk2004@yahoo.fr) for providing Tidal Gauge data of Djibouti. The time histories of water surface fluctuations at some gauge locations near Somali http://yalciner.ce.metu.edu.tr/sumatra/0007/somali.jpg The time histories of water surface fluctuations at some gauge locations near Kenya http://yalciner.ce.metu.edu.tr/sumatra/0007/kenya.jpg The time histories of water surface fluctuations at some gauge locations near Tanzanya http://yalciner.ce.metu.edu.tr/sumatra/0007/tanzanya.jpg The time histories of water surface fluctuations at some gauge locations near Madagascar http://yalciner.ce.metu.edu.tr/sumatra/0007/madagasar.jpg |
|
|
|
|