Central Limit Theorem
CLT states that if $X_1, X_2, \ldots$ are independent and identically random variables with mean $\mu$ and variance $\sigma^2$, then the distribution of the random variables defined as $$Z_n = \frac{1}{\sqrt{n}\sigma} \sum_{i=1}^n X_i - \mu$$ converges to a standard normal distribution. Let us check this numerically. We will take a large $n$ and consider a collection of random variables uniformly distributed on the unit interval. Note that we can produce such a sequence via 'rand'. Note that the mean and variance of these random variables is 1/2 and 1/12 respectively.
n = 20000;
X = rand(n,1); % uniform random variables
m = 1/2; % mean of X_i's
v = 1/12; % variance of X_i's
Z = sum( X - 1/2 ) / sqrt( n * v )
Z =

   -0.4022
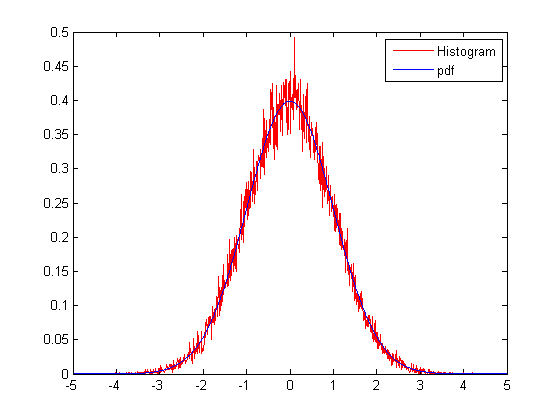
To check the distribution of $Z$, we can produce many such random variables and look at the histogram. We will also plot the standard normal pdf for comparison.
N = 50000; % number of random variables to produce
Z = zeros(1,N);
for k = 1:N,
    X = rand(n,1);
    Z(k) = sum( X - 1/2 ) / sqrt( n * v ); % this gives us N different realizations since 'sum' works on the columns
end


delta = 0.01;
t = -5:delta:5;

ind = 0;
for t1 = t,
    ind = ind + 1;
    p(ind) = (1/delta) * (1/N)*sum( ( t1 - delta/2 < Z ) .* ( Z < t1 + delta/2 ) ) ;
end

figure;
plot(t,p,'r');
hold on;

f = ( 1 / sqrt(2*pi) ) * exp( -t.^2 / 2 );  % this is the standard normal pdf
plot(t,f);
legend('Histogram', 'pdf');
Ilker Bayram, Istanbul Teknik Universitesi, 2015