1. I. Ketin, Bull. Min. Res. Explor. Inst. Turkey 72, 1 (1969).
2. A. A. Barka, Bull. Seismol. Soc. Am. 86, 1238 (1996).
3. M. N. Toksoz, A. F. Shakal, and A. J. Michael, Pageoph 117, 1258 (1979).
4. R. S. Stein, A. A. Barka, J. H. Dieterich, Geophys. J. Int. 128, 594 (1997).
5. R. A. Harris, J. Geophys. Res. 103, 24,347 (1998).
6. R. S. Stein, Nature 402, 605 (1999).
7. A. Ito, et al., Precise Distribution of Aftershocks of the Izmit Earthquake of August 17, 1999, Turkey, Eos Trans. 80, F662 (1999).
8. We calculate Coulomb failure stress (![]() ,
,
![]() ) where D
) where D![]() is the change in shear stress on the receiver fault, m is the coefficient
of friction, D
is the change in shear stress on the receiver fault, m is the coefficient
of friction, D![]() is the change in normal
stress, and Bk is Skempton's coefficient. Stress values are
found by elastic dislocation in a half space (33); viscoelastic effects are
neglected. We used a slip model for the Izmit earthquake developed from InSAR
(radar satellite interferometry) (34); slip models of other earthquakes are
from (35) and (4). Here the assumed friction coefficient is 0.2, as has been
found for strike-slip faults with large cumulative slip (36,37). A 100-bar
deviatoric tectonic stress with compression oriented N55°W (38) is used,
under which optimally oriented right-lateral faults strike E-W except along
the rupture surface
is the change in normal
stress, and Bk is Skempton's coefficient. Stress values are
found by elastic dislocation in a half space (33); viscoelastic effects are
neglected. We used a slip model for the Izmit earthquake developed from InSAR
(radar satellite interferometry) (34); slip models of other earthquakes are
from (35) and (4). Here the assumed friction coefficient is 0.2, as has been
found for strike-slip faults with large cumulative slip (36,37). A 100-bar
deviatoric tectonic stress with compression oriented N55°W (38) is used,
under which optimally oriented right-lateral faults strike E-W except along
the rupture surface
9. Hubert-Ferrari et al., Nature 404, 269 (2000).
10. Y. Ogata, J. Geophys. Res. 104, 17995 (1999).
11. We use two probability distributions. The Brownian
passage time function of Matthews (39) takes the form ![]() ,
where m is the average repeat time and a is the coefficient
of variation. The lognormal distribution (40) is also used for time-dependent
calculations. No catalog is adequate to estimate the coefficient of variation
of the inter-event time, so we use a conservative value of 0.5 (10, 41).
,
where m is the average repeat time and a is the coefficient
of variation. The lognormal distribution (40) is also used for time-dependent
calculations. No catalog is adequate to estimate the coefficient of variation
of the inter-event time, so we use a conservative value of 0.5 (10, 41).
12. N. N. Ambraseys, C. F. Finkel, Terra Nova 3, 527 (1991).
13. N. N. Ambraseys, C. F. Finkel, Terra Nova 2, 167 (1990).
14. N. N. Ambraseys, C. F. Finkel, The Seismicity of Turkey and Adjacent Areas: A historical review, 1500-1800 (Muhittin Salih EREN, Istanbul, 1995).
15. C. F. Finkel, N. N. Ambraseys, The Marmara Sea earthquake of 10 July 1894 and its effect on historic buildings, Anatolia Moderna Yeni Anadolu VII (Bibliothèque de l'Institut Français d'Etudes Anatoliennes-Georges Dumézil, Paris, 1996), vol. 43.
16. W. H. Bakun, C. M. Wentworth, Bull. Seismol. Soc. Amer. 87, 1502 (1997)
17. The relation Mi=(MMIi+3.29+0.0206di)/1.68, where di is distance in km between intensity (MMI) observation and epicenter, was developed from 30 California shocks with both intensity and instrumental observations (16). The RMS fit to this relation is calculated for trial locations on a 5x5 km-spaced grid. We excluded felt reports (MMI<IV) and MMI>VIII observations were saturated to VIII because criteria for higher intensities involve observations other than building damage, and because for poorly constructed masonry, damage may be total at MMI=VIII.
18. We calibrated with the 1912 Ms=7.4 Saros-Marmara (360 intensities; (42)), 1963 Ms=6.4 Yalova (11 intensities; (43)), and 1999 M=7.4 Izmit earthquakes (185 intensities). For the 1912 and 1999 events, we randomly selected 50 sets of 25 intensities (the mean number for the historical shocks) to calculate epicentral and magnitude errors. This yields intensity centers within ±50 km (at 95% confid.) of the instrumental epicenters, and gives the correct M or Ms within ±0.3 magnitude units. Site corrections were not made because we find no tendency for epicenters to be pulled toward sedimentary sites, and because improvement was only found in (16) when detailed site geology was available
19. J. R. Parke, et al., Terra Nova , in press.
20. D. L. Wells, K. J. Coppersmith, Bull. Seismol. Soc. Amer. 84, 974 (1994).
21. The most recent event for the Yalova segment is 1894.6; Izmit segment, 1999.7; Ganos fault, 1912.7; Prince's Islands fault, 1766.7; central Marmara fault, 1509.8.
22. Working Group Calif. Earthquake Probabilities, Seismic hazards in southern California: Probable earthquakes, 1994-2014, Bull. Seismol. Soc. Amer. 85, 379-439 (1995).
23. C. Straub, H.-G. Kahle, C. Schindler, J. Geophys. Res. 102, 27,587 (1997).
24. K. Aki, Bull. Earthquake Res. Ins. 43, 237 (1965).
25. S. G. Wesnousky, Bull. Seismol. Soc. Amer. 89, 1131 (1999).
26. Includes earthquakes in 1509, 1556, 1719, 1754, 1766, 1855, 1857, 1863, 1877, 1894, 1953, and 1964 from (12-14) and (35).
27. AD 447, 478, 542, 557, 740, 869, 989, 1323.
28. J. Dieterich, J. Geophys. Res. 99, 2601 (1994).
29. J. H. Dieterich, B. Kilgore, Proc. Nat. Acad. of Sci. USA 93, 3787 (1996).
30. S. Toda, R. S. Stein, P. A. Reasenberg, J. H. Dieterich, J. Geophys. Res. 103, 24,543 (1998).
31. The transient change in expected earthquake rate R(t)
after a stress change, ![]() can be related
to the probability of an earthquake of a given size over the time interval
Dt through a nonstationary Poisson process as
can be related
to the probability of an earthquake of a given size over the time interval
Dt through a nonstationary Poisson process as ![]() .
Here r is the background seismicity rate, Dt is the Coulomb stress
change, a is a state/rate constitutive parameter, s the total normal
stress, t is time, and ta is the transient decay duration.
The transient probability change is superimposed on the permanent change,
which results from an advance or delay in the expected time until failure
caused by the stress change. Integrating for is the expected number of earthquakes
in the interval Dt, N(t) yields
.
Here r is the background seismicity rate, Dt is the Coulomb stress
change, a is a state/rate constitutive parameter, s the total normal
stress, t is time, and ta is the transient decay duration.
The transient probability change is superimposed on the permanent change,
which results from an advance or delay in the expected time until failure
caused by the stress change. Integrating for is the expected number of earthquakes
in the interval Dt, N(t) yields ![]() ,
where rp is the expected rate of earthquakes associated with
the permanent probability change. This rate can be determined by again applying
a stationary Poisson probability expression as
,
where rp is the expected rate of earthquakes associated with
the permanent probability change. This rate can be determined by again applying
a stationary Poisson probability expression as ![]() ,
where Pc is a conditional probability, which can be calculated
using any distribution. In addition to the inter-event time and elapsed time
on each fault, this technique requires values for the stress change on each
fault (we use the average calculated stress change resolved on each fault
surface), the transient decay (shown in Fig. 4A from data in (4)), and a stressing
rate on each fault derived from the fault geometry and the observed strain
rate (0.1 bar/yr) (4). We performed 1000 Monte Carlo trials to establish error
bounds (44). The four parameters for the Monte Carlo simulations are drawn
at random from a normal distribution with a shape factor of 0.25 about each
estimate, except for the inter-event time for which the shape factor is 0.5.
Alternating Monte Carlo trials were run with a Brownian passage time and lognormal
distribution.
,
where Pc is a conditional probability, which can be calculated
using any distribution. In addition to the inter-event time and elapsed time
on each fault, this technique requires values for the stress change on each
fault (we use the average calculated stress change resolved on each fault
surface), the transient decay (shown in Fig. 4A from data in (4)), and a stressing
rate on each fault derived from the fault geometry and the observed strain
rate (0.1 bar/yr) (4). We performed 1000 Monte Carlo trials to establish error
bounds (44). The four parameters for the Monte Carlo simulations are drawn
at random from a normal distribution with a shape factor of 0.25 about each
estimate, except for the inter-event time for which the shape factor is 0.5.
Alternating Monte Carlo trials were run with a Brownian passage time and lognormal
distribution.
32. D. J. Wald, V. Quitoriano, T. H. Heaton, H. Kanamori, Earthquake Spectra 15, 557 (1999).
33. Y. Okada, Bull. Seismol. Soc. Am. 82, 1018 (1992)
34. T. J. Wright, P. C. England, E. J. Fielding, M. Haynes, B. E. Parsons, Eos Trans. 80, F671 (1999).
35. Nalbant, S. S., A. Hubert, G. C. P. King, J. Geophys. Res, 103, 24469 (1998)
36. P. A. Reasenberg, R. W. Simpson, Science 255, 1687 (1992).
37. T. Parsons, R. S. Stein, R. W. Simpson, P. A. Reasenberg, J. Geophys. Res. 104, 20,183 (1999).
38. C. Gürbüz, et al., Tectonophysics in press (2000).
39. M. V. Matthews, J. Geophys. Res. in press.
40. Working Group Calif. Earthquake Probabilities, U.S. Geol. Surv. Circular 1053 (1990).
41. Working Group Calif. Earthquake Probabilities, U. S. Geol. Surv. Open File Rep. 99-517 (1999).
42. N. N. Ambraseys, C. F. Finkel, Annales Geophysicae 5B, 701 (1987).
43. N. N. Ambraseys, Earthqu. Engin. and Structural Dynamics 17, 1 (1988).
44. J. C. Savage, Bull. Seismol. Soc. Am. 81, 862 (1991).
45. The combined probability expression P=1-(1-Pa)(1-Pb)(1-Pc) for faults a-c assumes independent sources of hazard, since we cannot include future interactions and for all but the most recent earthquakes, we cannot include past interactions.
46. G. C. P. King, R. S. Stein, J. Lin, Bull. Seismol. Soc. Amer. 84, 935 (1994).
47. We thank N. Ambraseys, T. Wright, E. Fielding, A. Ito, J. Parke, and C. Finkel for sharing their insights and preliminary results with us, W. Bakun for his code and his review, and J. C. Savage, and W. Thatcher, C. Straub, and S. Kriesch for incisive reviews. Support from SwissRe is gratefully acknowledged.
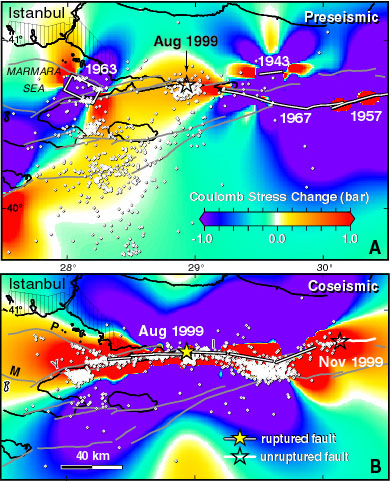
Fig. 1. (A) Stress change caused by earthquakes since 1900. Shown are the maximum Coulomb stress changes between 0 and 20 km depth on optimally-oriented vertical strike-slip faults (8,46). Seismicity recorded since installation of IZINET (1993-July 1999 (7)) has uniform coverage over the region shown. Calculated stress increases are associated with heightened seismicity rates and with the future epicenter of the 17 August 1999 Izmit earthquake; sites of decreased stress exhibit low seismicity. Before the 1999 event, two studies (4, 35) identified this site as having increased stress and thus hazard. (B) Izmit aftershocks are associated with stress increases caused by the main rupture (first 12 days from IZINET (7)), such as the Yalova cluster southeast of "Y," and the occurrence of the 12 November Düzce earthquake. Faults: Y-Yalova, P-Prince's Islands, M-Marmara, I-Izmit.
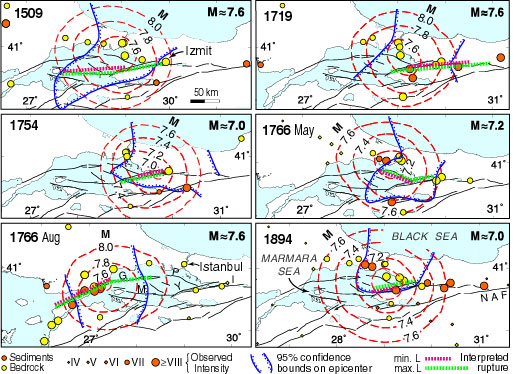
Fig. 2. Large historical earthquakes since 1500. Intensities (dots) were assigned from damage descriptions compiled by (12-15). Red dashed contours give the moment magnitude M needed to satisfy the observations for a given location (16), because the farther the epicenter is from the observations, the larger the M required to satisfy them. The confidence on location is governed by the relative intensities; magnitude is a function of absolute intensities. We assigned earthquakes to faults by minimizing M within the 95% confidence region (17,18). Faults labeled in lower panels: I-Izmit, Y-Yalova, P-Prince's Islands, M-Marmara, G-Ganos, NAF-North Anatolia fault.
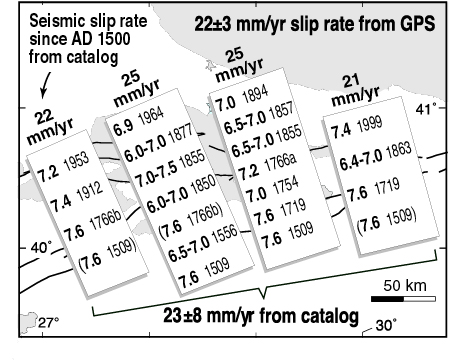
Fig. 3. Seismic slip from the 500-yr-long catalog of Fig. 2 is summed in four transects across the North Anatolia fault system in the Marmara Sea. All known or estimated M7 sources are included (26). The mean seismic strain release rate balances the strain accumulation rate observed from GPS geodesy (23). Whether earthquakes in parentheses extend to a given transect is uncertain. '1766a' is May; '1766b' is August.
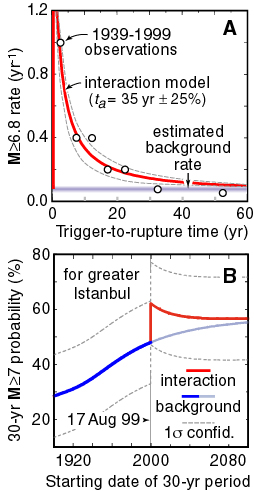
Fig. 4. A. Transient response to stress transfer. The thirteen M³6.8 North Anatolian earthquakes for which the stress at the future epicenter was increased by ³0.5 bars are plotted as a function of time. The earthquake rate decays as t -1 in a manner identical to aftershocks, as predicted by (28-31). B. Calculated probability of a M³7 earthquake (equivalent to MMIVIII shaking in greater Istanbul) as a function of time. The probability on each of three faults is summed (45). The large but decaying probability increase is caused by the 17 August 1999 Izmit earthquake. ‘Background’ tracks the probability from earthquake renewal; 'interaction' includes renewal and stress transfer. Light blue curve gives the probability had the Izmit earthquake not occurred.